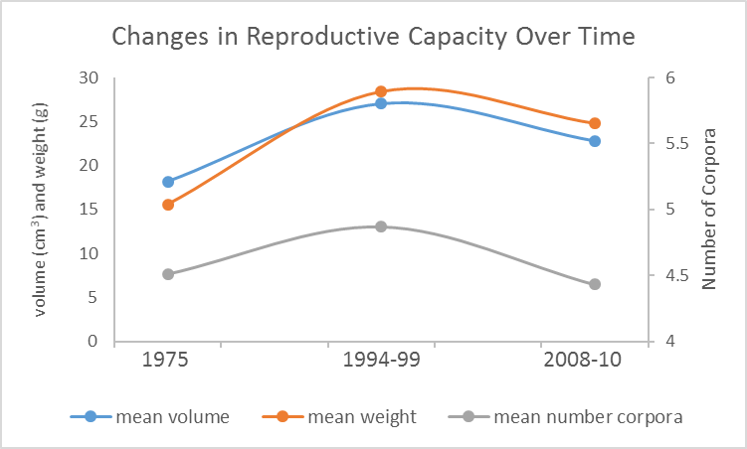
  This is the graph that I presented at my most recent conference I attended in Amherst, Massachusetts. It was not really a conference but a 2-day training for young professionals associated with the National Climate Science Center (CSC) Network. I am not actually apart of the CSC Network, but none of the Alaska CSC members were able to make it and the opportunity was made available to University of Alaska students, where I expressed interest and was flown across the country to network, collaborate, learn how to overcome challenges in multidisciplinary studies and deliver a speed talk about my research. I was given 3 slides and 3 minutes. A challenge I was excited to accept! I enjoy taking my research and making it interesting and digestible to diverse audiences, plus this time I had more progressive results than at my previous talks. These were my results:
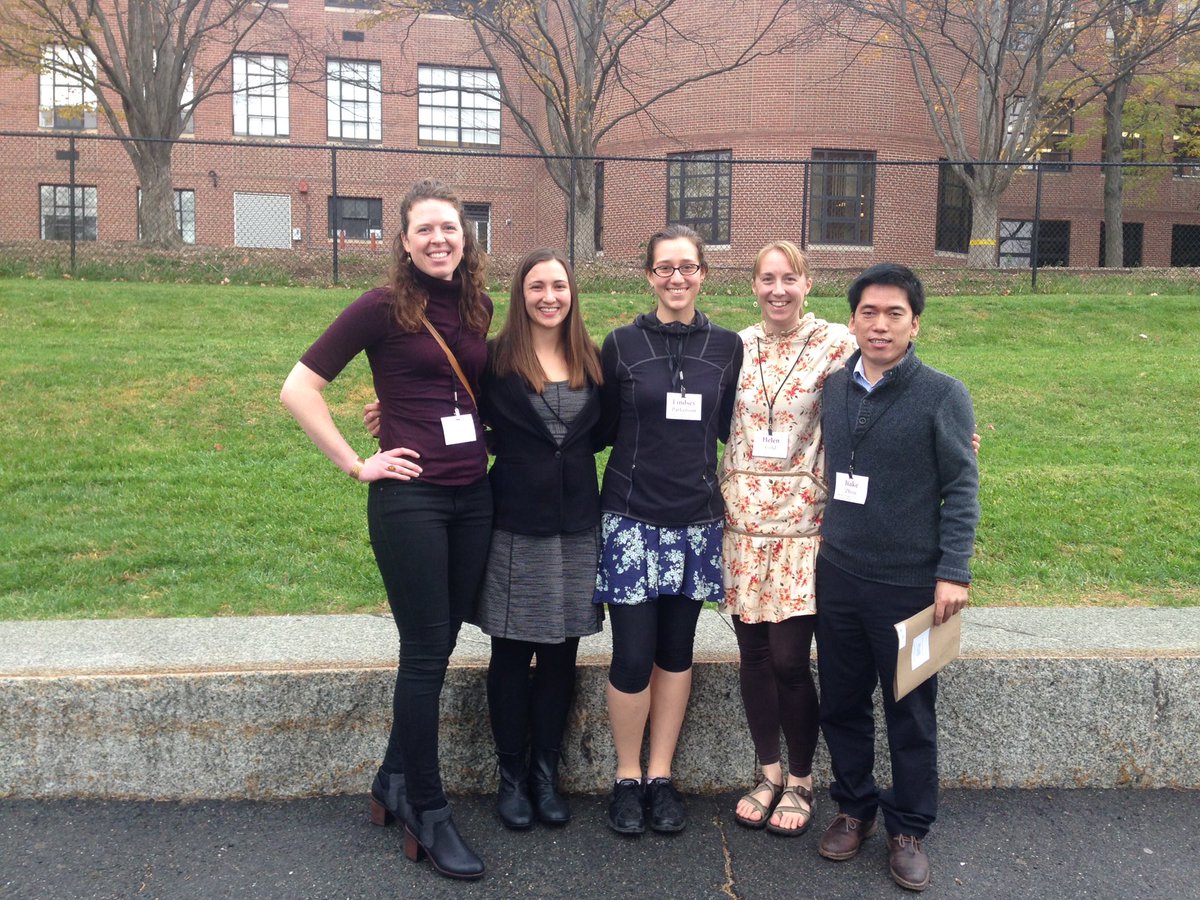
Cool…so why might this be? This is where things got exciting to me. My results were explainable! In the 1960s hunting restrictions were put in place for Pacific walruses. The population started to increase and it is thought that carrying capacity was reached at 1975 or shortly thereafter. As the population peaked, space and food became limited. Females were not able to get enough to eat and consequently could not afford to ovulate or bring a fetus to full term. Then in the 1980s, the hunting restrictions were lifted, the population was reduced and resources became more plentiful. Females had access to adequate food and started ovulating and calving more often and more successfully, hence the increase in size and number of corpora in the 90s. We don’t have much information for the 2008-10 time period but my results suggest that the population was reproducing at levels higher than in the 70s and slightly lower than in the 90s. This is great. Amazing! A grad students dream—having data that is statistically significant and trends that are explainable. “Go home and get to writing up your thesis,” I told myself feeling proud and accomplished. Me feeling proud and accomplished with the rest of the Alaska CSC group in Amherst, MA. A week after presenting this “amazing” stuff, I got to thinking and I awoke to a harsh reality. I was dreaming. I was sitting in the library in Juneau, at the same table I am actually typing this up now. I was staring at excel spread sheets and graphs of my data. I wanted to be sure that I was interpreting my results correctly, that in a few months from now when I presented this information at my thesis defense no one would point and laugh and say, “Hah, good one Jenell, but you really didn’t consider x, y and z here.” And I would be embarrassed and potentially fail. It was a good practice. I asked myself, “Is there anything else that could account for these differences in size, weight and number of corpora between samples?” The obvious thing I had been dealing with was the difference in preservatives used. Two of the three sets of ovaries were preserved in formalin whereas the smallest ovaries from 1975 were preserved in ethanol. I had already been working on a pilot study and the results from our pilot study said that there were no significant differences between treatment types. “Ok, what else? What else?” I racked my brains for a moment. Locations. That was different. The 1975 samples were from Little Diomede and the others were from St. Lawrence Island. But that shouldn’t matter. They are all samples from one population that migrates from St. Lawrence up to Little Diomede. Oh, my gosh. They migrate. They are harvested as they migrate. So they are killed as the ice breaks up first in the Bering and then up toward the Chukchi Sea. What do the harvest dates look like between locations??? 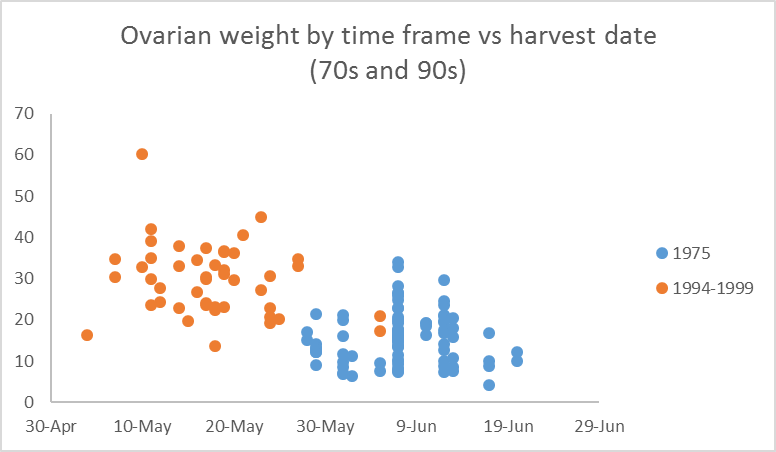 I am waiting to obtain harvest date info on the 2008-10 time frame but these 2 time periods have really distinct harvest windows. Volume showed the same trend as weight of ovaries. They look different. Really different. In fact, there is almost no overlap. I hadn’t accounted for this. I am no longer comparing apples to apples here. What am I going to do?
0 Comments
Leave a Reply. |
AuthorHi, I'm Jenell. Biologist, student, outdoors woman and author of Mother Walrus. Archives
March 2019
Categories |

 RSS Feed
