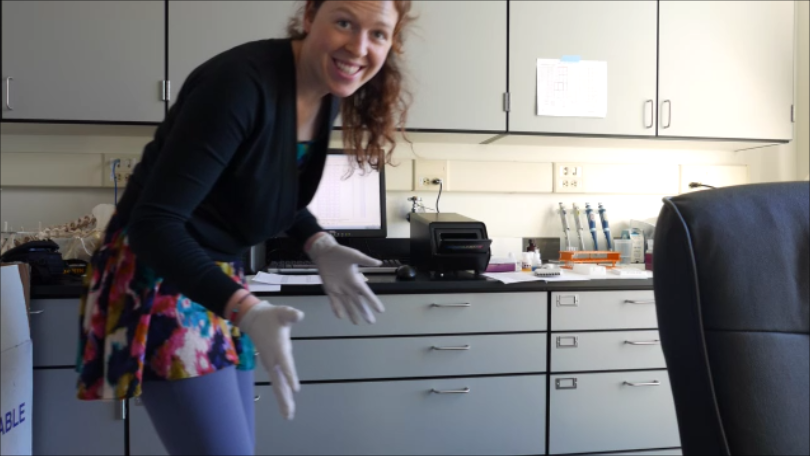
Today is the day. And I'm pretty excited about it!
I intended to get out of bed around 7. I dismissed my 3 or 4 alarms and rolled over to see not even the faintest beams of light through my shades. I allowed myself 20 more minutes. “Today is the day,” I thought. Today is the day I nail it. My very last go-round in the endocrine lab. I don’t think I’ve ever ran an assay and had every sample come out successfully. But this is not my first or second time with these particular samples. No. This is the third time for most of them. I slipped into my slippers, greeted my dog on the way to the kitchen, and poured myself a glass of water to wash down the ball of sunshine my body is deficient of for about 5-6 months out of the year. I put together a cold sandwich. The Dean is visiting our campus today and a student lunch is provided but the chances of me pipetting over the lunch hour are too high to risk going without. I reach for the coffee pot, second in line of the joys of dark mornings (first being the thick ruff of my Hedlund husky that I scratch and bury my face into each morning). Here I come to a cross-roads. In the summer I could go on my merry way without the dark liquid. But on a frosty December morning such as this, my day’s happiness and productiveness depend on it. But I must be cautious. No one wants the shakes when they are transferring microliters of precious samples that have traveled hundreds of miles and gone through a dozen steps to be dropped anywhere outside the pencil eraser-sized cup (a “well”) in the assay tray. I settle on a half cup.
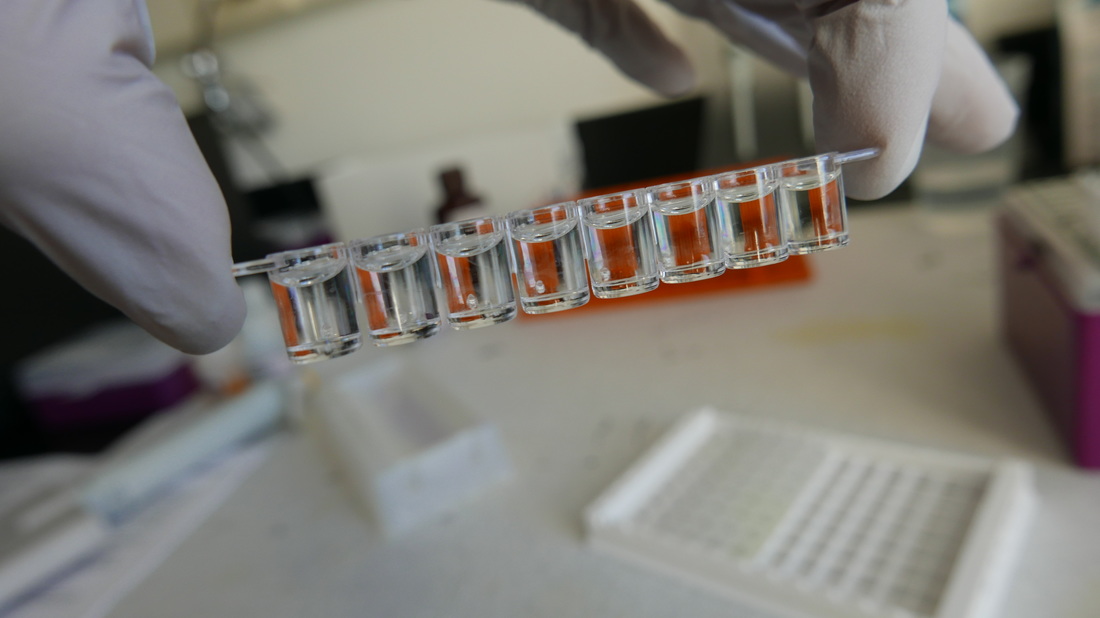
A row of "wells."
I run out of the house to start my car. Two days ago I opened my back door and it resisted, so I cranked a little harder. The entire panel of my passenger side back door popped off. I threw it in the back. Today, my driver’s side door is frozen shut. I have to crawl through the back. I can’t be bothered to take this thing in as long as it’s getting me from point a to point b.
Half an hour later I’m in the lab rooting around in the fridge. It’s jam packed with blue and yellow boxes labeled, “testosterone,” “cortisol,” and “corticosterone.” I remove a few of them to get to the one labeled “progesterone.” A beaker of clear liquid labeled “fecal extraction” wobbled precariously. I hadn’t noticed it there. I would like to say my lab mates should know better than to leave something like that balancing in the fridge, but the truth is, I should know them better. I riffle through the progesterone kit and begin my hodge-podge assembled of my assay, pulling out buffer from the side door in the main fridge, grabbing the control solution from the mini fridge, and piecemealing together unused well columns from a recycled tray. Often we don’t have enough samples to use up an entire assay plate, so we save and label the leftovers and use them up later. Kits are costly, about $250 for each individual progesterone kit. Conserving materials is wise and limiting mistakes is necessary! 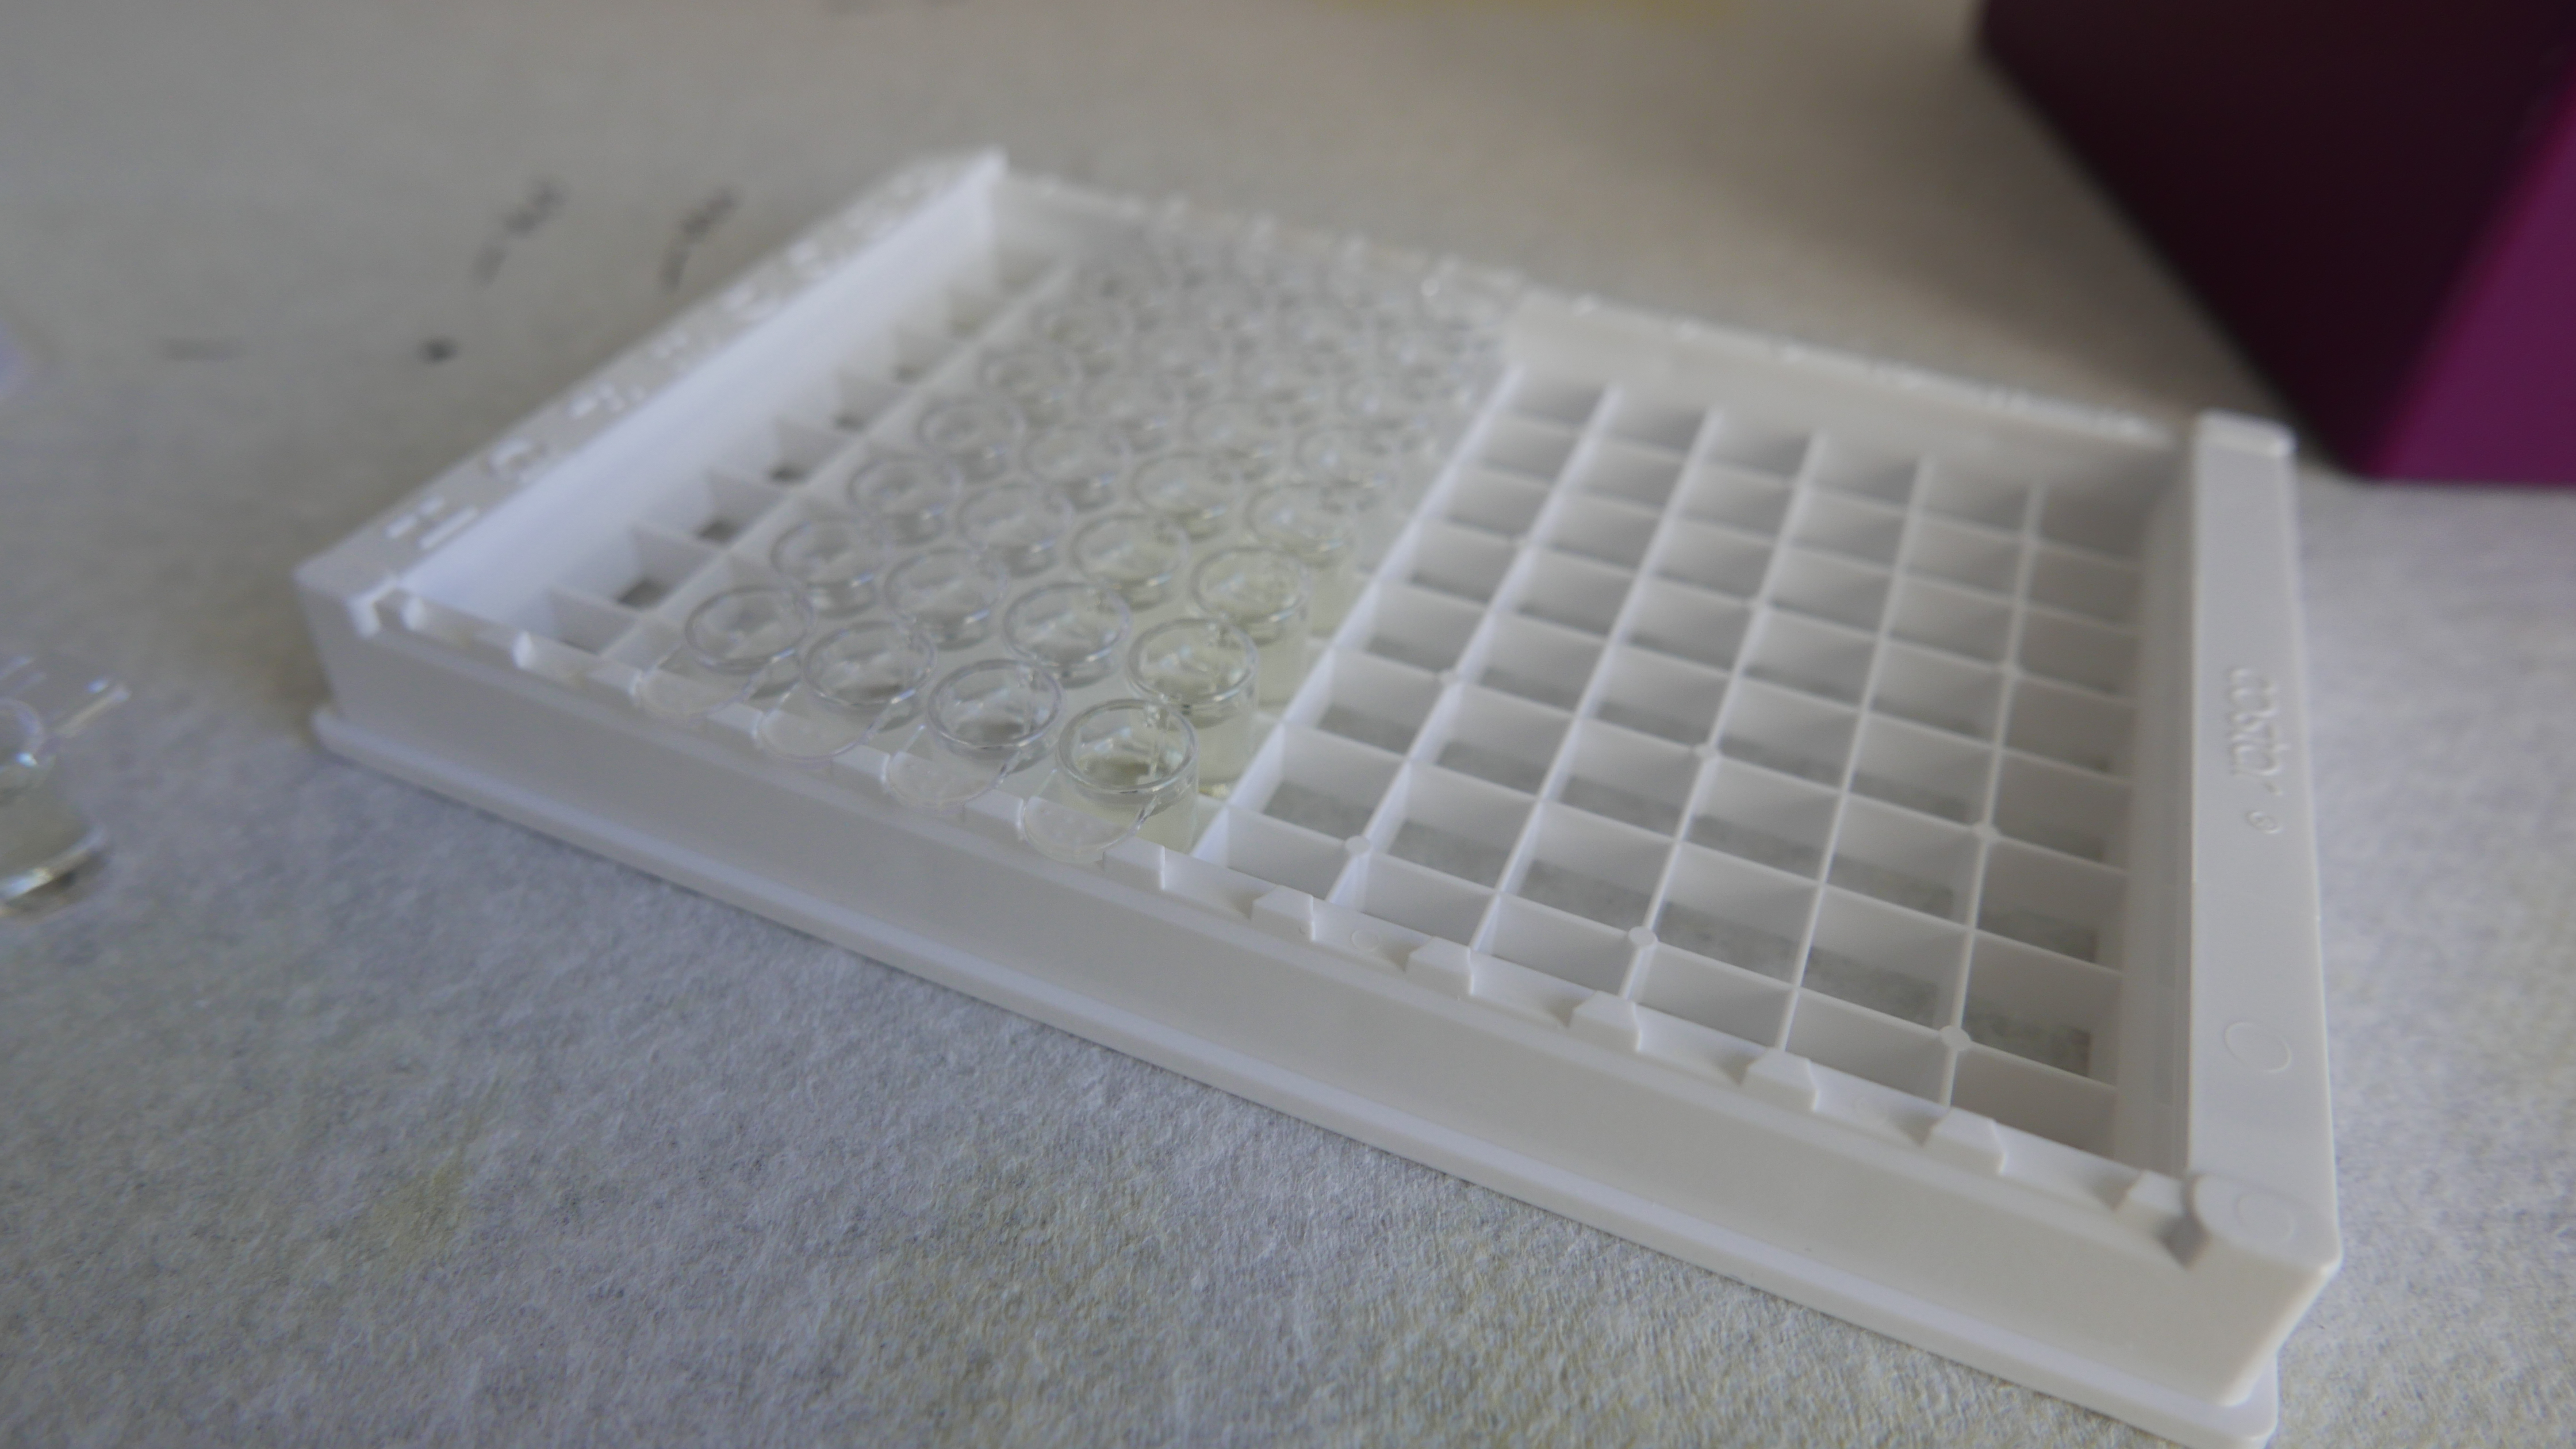
An assay tray.
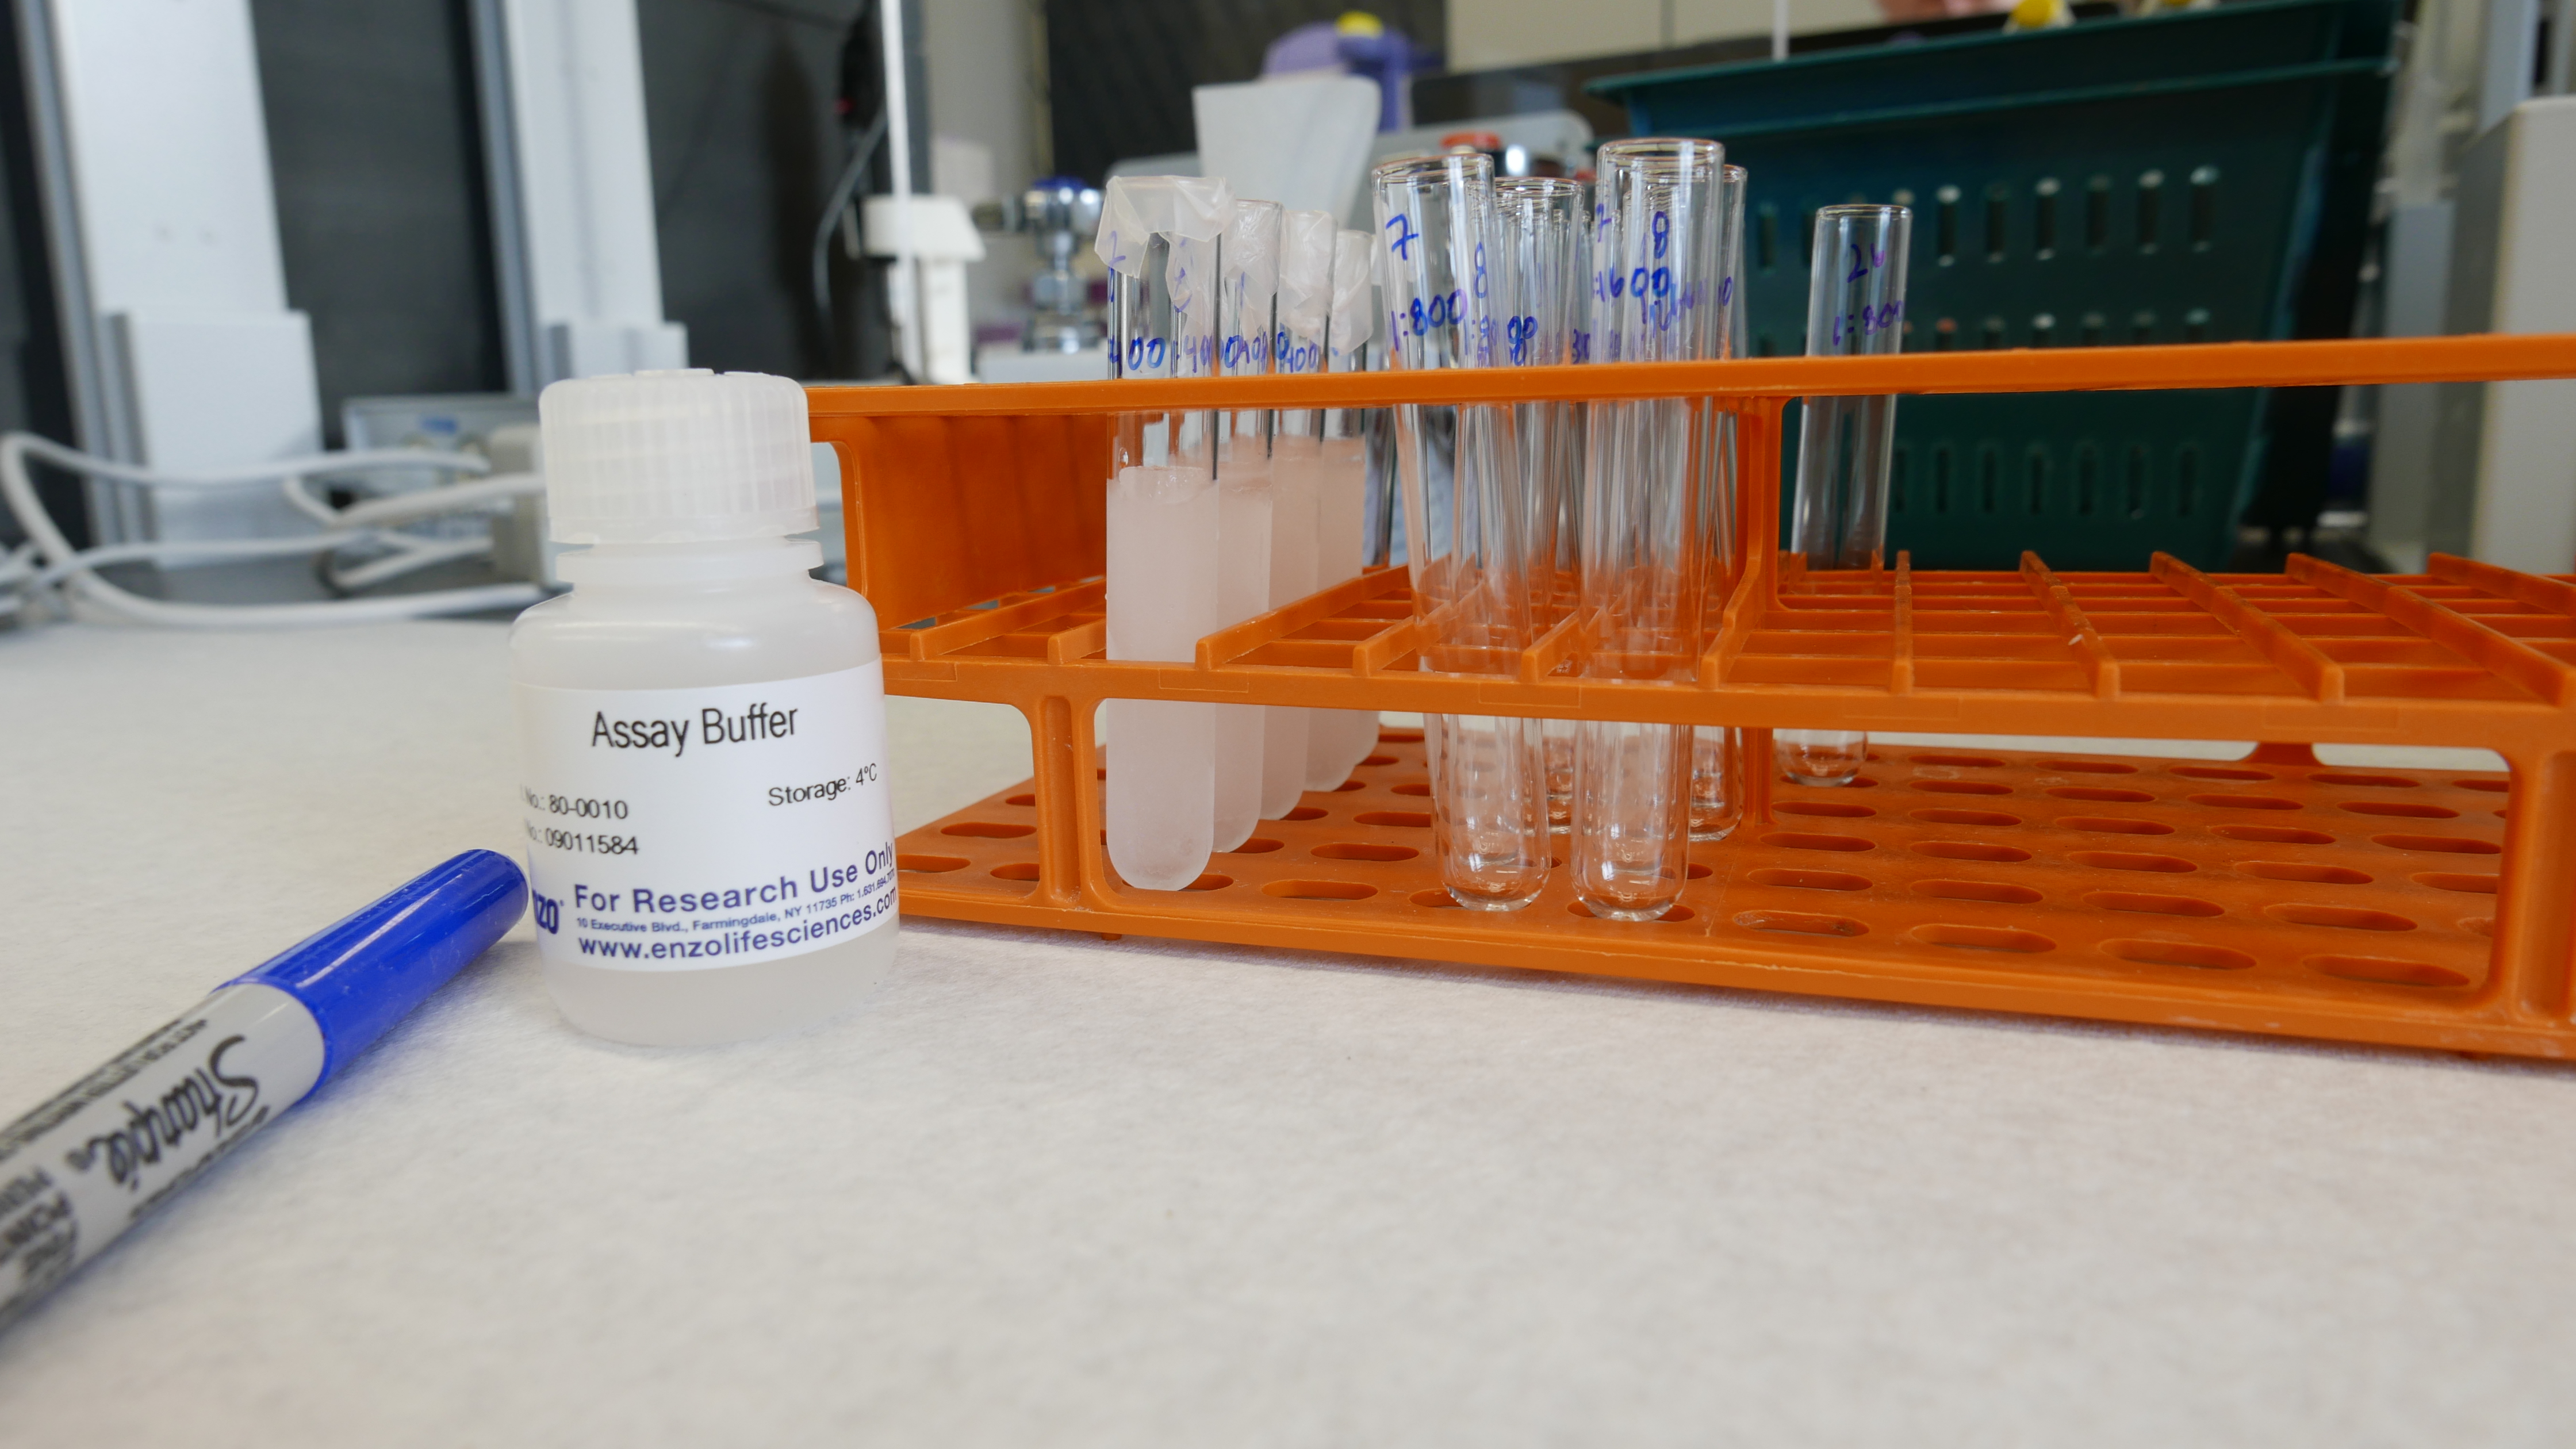
Sample prep. Thawing out my dilutions and allowing the assay buffer to thaw to room temperature.
A couple hours later and I have my fingers crossed that this assay will be a success. I have been running these damn things on and off for more than a year. Some, because we obtained new samples (wahoo!), but mainly they are redos that I must recalculate over and over again. You see the trouble is no one has done this before, ran progesterone on walrus tissues. And these aren’t just any old piece of tissue (the skin, blubber etc.); the part of the ovary I am observing (the Corpora Lutea or CL) is the source of progesterone production itself. I have yet to find literature looking at progesterone concentration in the CL of any mammal. This makes it tricky to blindly guess. Luckily for me, our lab has an excellent technician who’s been invaluable at assisting students in endocrinology studies. But today I am on my own.
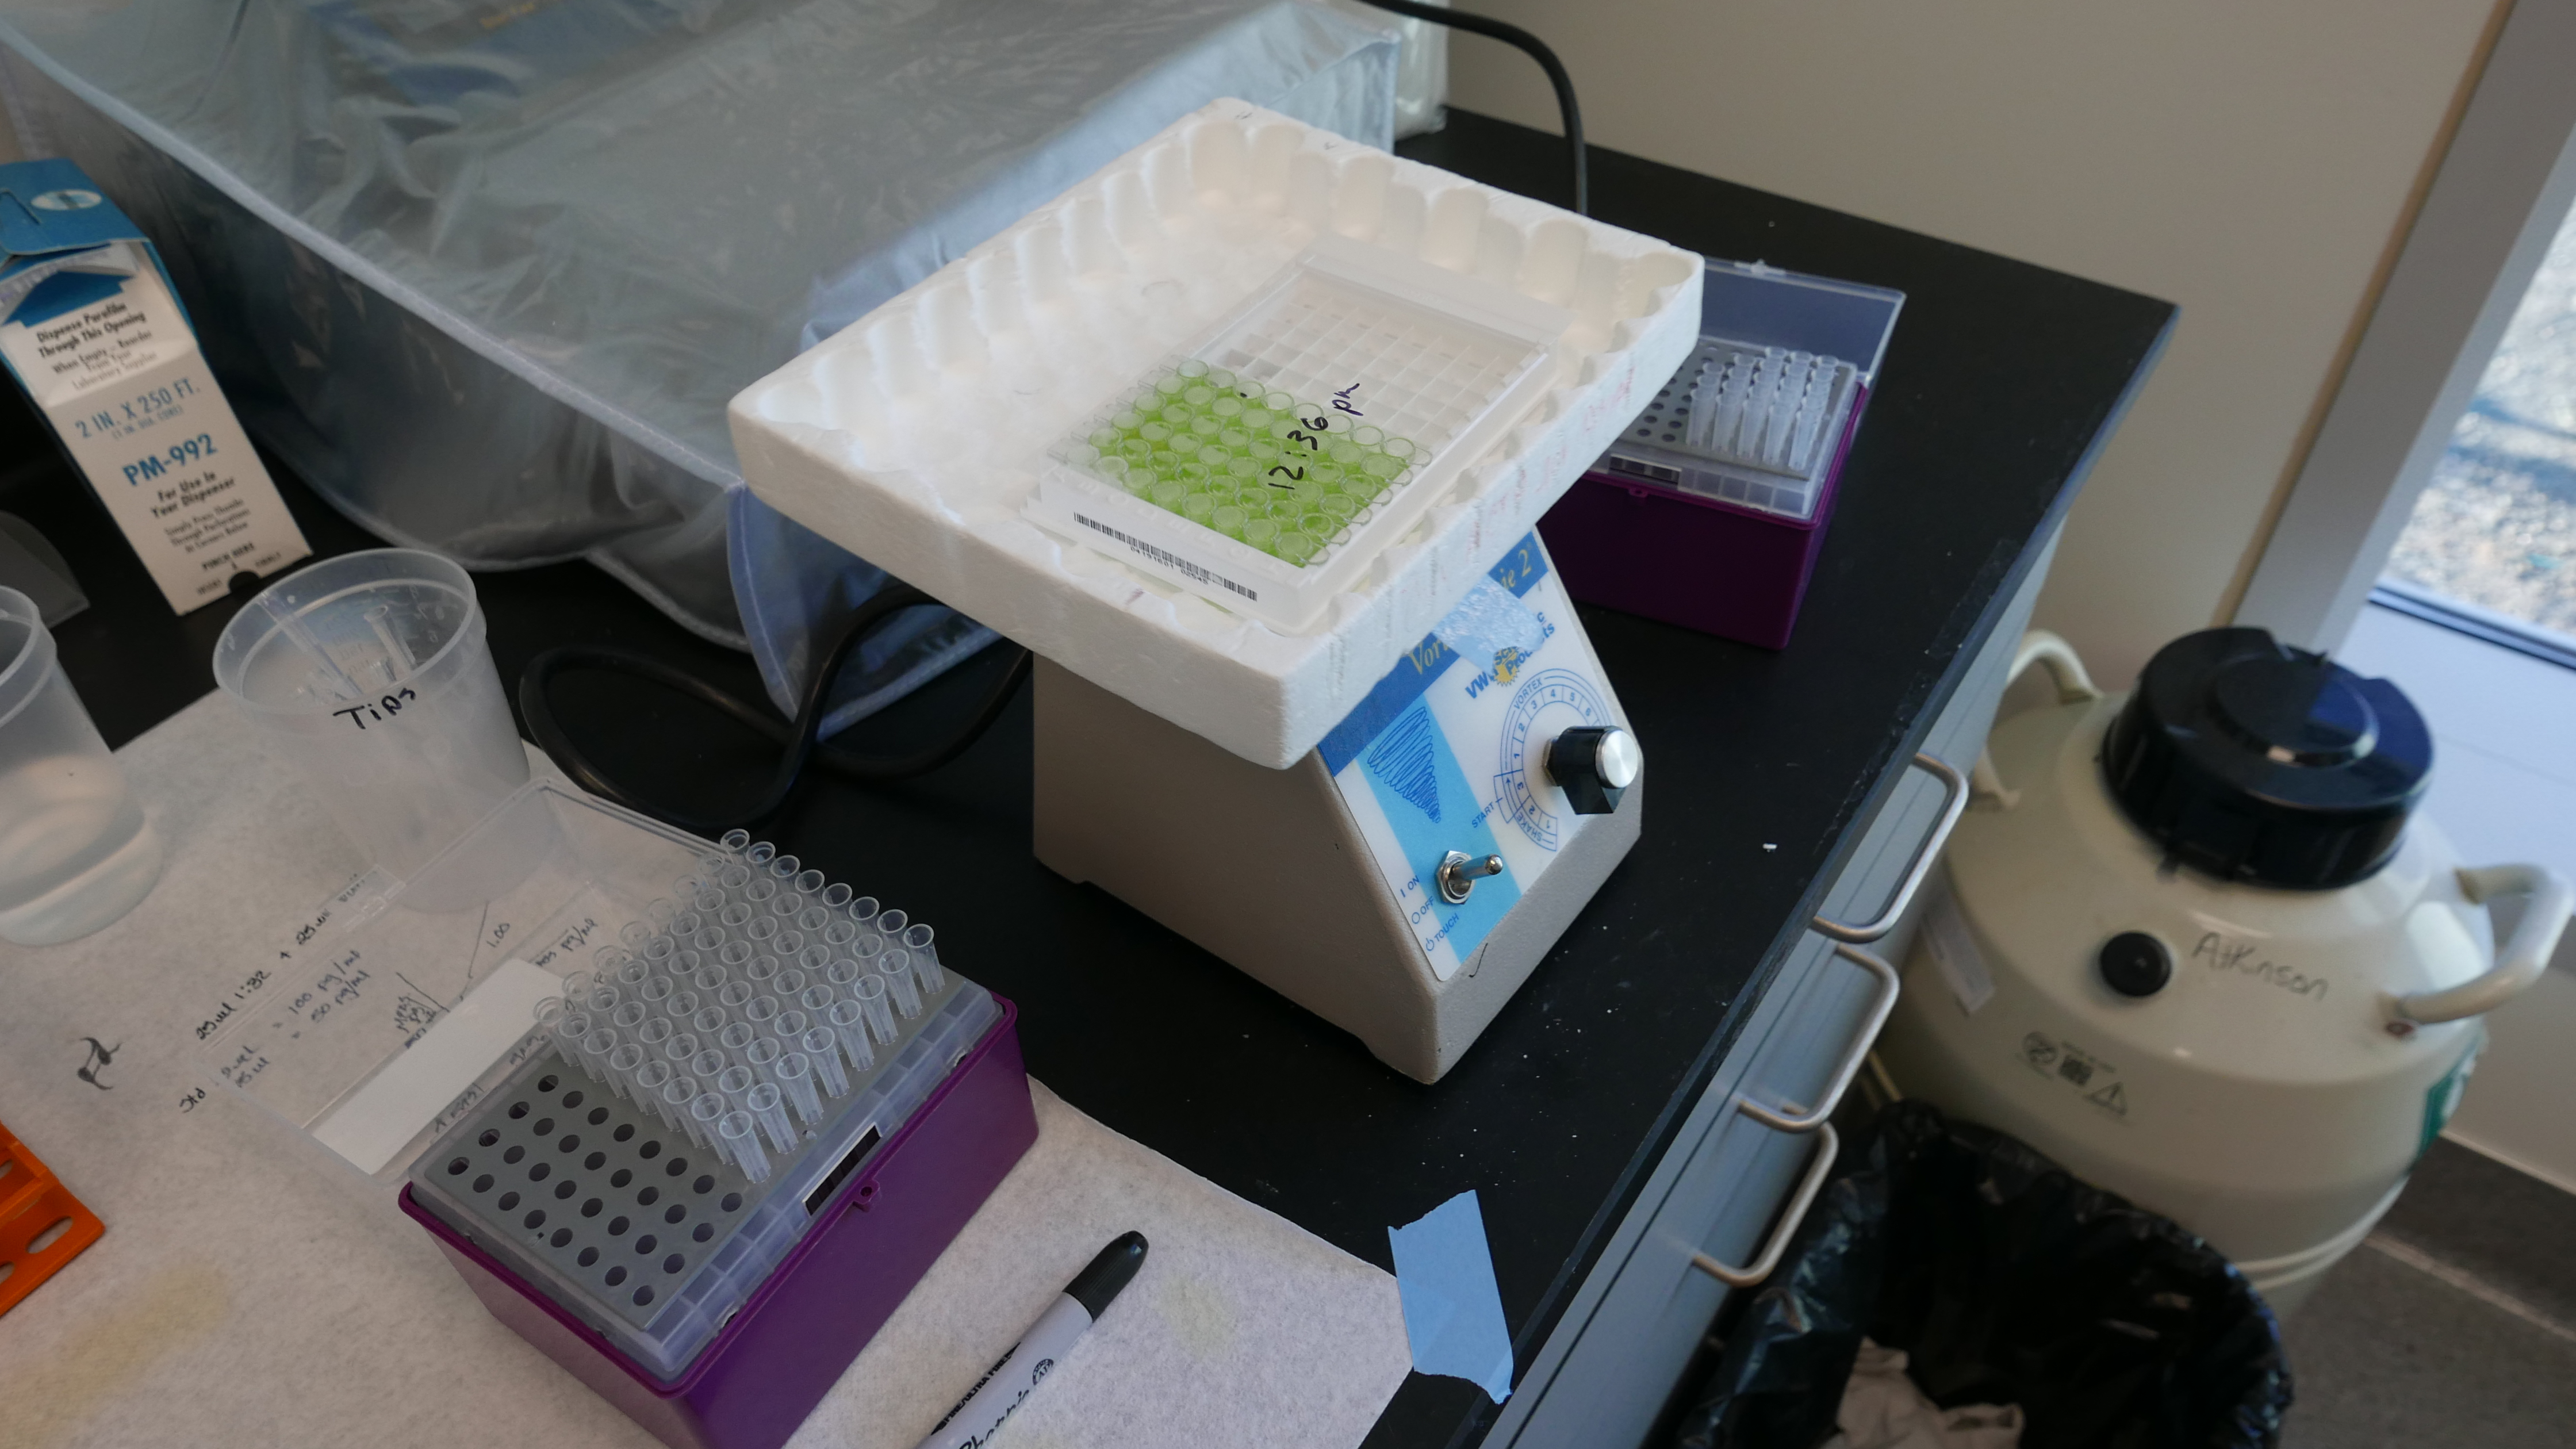
Plate is ready to shake!
The plate shakes and by some miracle the 2-hour time window of shaking falls during the student lunch! Yay for Chinese food! Of course, the food arrives late and the Dean is behind schedule so I only have enough time to dine and ditch before time is up and I must complete the next step. In the next step I dump all of the liquid out of the wells and wash them out with something similar to a detergent. This step gets rid of all the “junk” floating around that isn’t progesterone. The progesterone molecules (antigens really) have spent the past 2 hours binding to their respective antibodies. The antibodies come with the kit. They are stuck to the bottom of those tiny cups we call wells and sit upright, arms wide open, waiting for the progesterone antigens to bind to them.
The blue antibodies are stuck to the bottom of the wells, the red antigens are the progesterone molecules from my walrus tissues floating around. They will bind to the antibodies. Source: http://www.ducksters.com/science/biology/antibodies_and_antigens.gif
The plate is washed, I follow the chemical recipe and now the plate is sitting. No shaking for this last part. I am anxiously waiting. I don’t allow any negative thoughts or potential mistakes to enter my mind. I look down at the fortune cookie I saved from lunch. Nope. I’m not even going to open that, could be some bad mojo in there. I’m acting more like some superstitious baseball pitcher before playoffs than a scientist. Instead of letting my mind wander in all the wrong directions, I let my dog out and catch some air. I’ll head up early to prepare for the final steps.
Check out this video on what it looks like to "wash the plate."
0 Comments
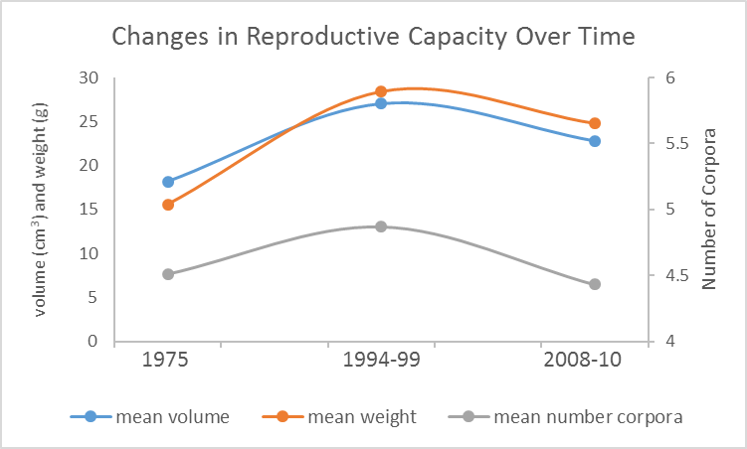  This is the graph that I presented at my most recent conference I attended in Amherst, Massachusetts. It was not really a conference but a 2-day training for young professionals associated with the National Climate Science Center (CSC) Network. I am not actually apart of the CSC Network, but none of the Alaska CSC members were able to make it and the opportunity was made available to University of Alaska students, where I expressed interest and was flown across the country to network, collaborate, learn how to overcome challenges in multidisciplinary studies and deliver a speed talk about my research. I was given 3 slides and 3 minutes. A challenge I was excited to accept! I enjoy taking my research and making it interesting and digestible to diverse audiences, plus this time I had more progressive results than at my previous talks. These were my results:
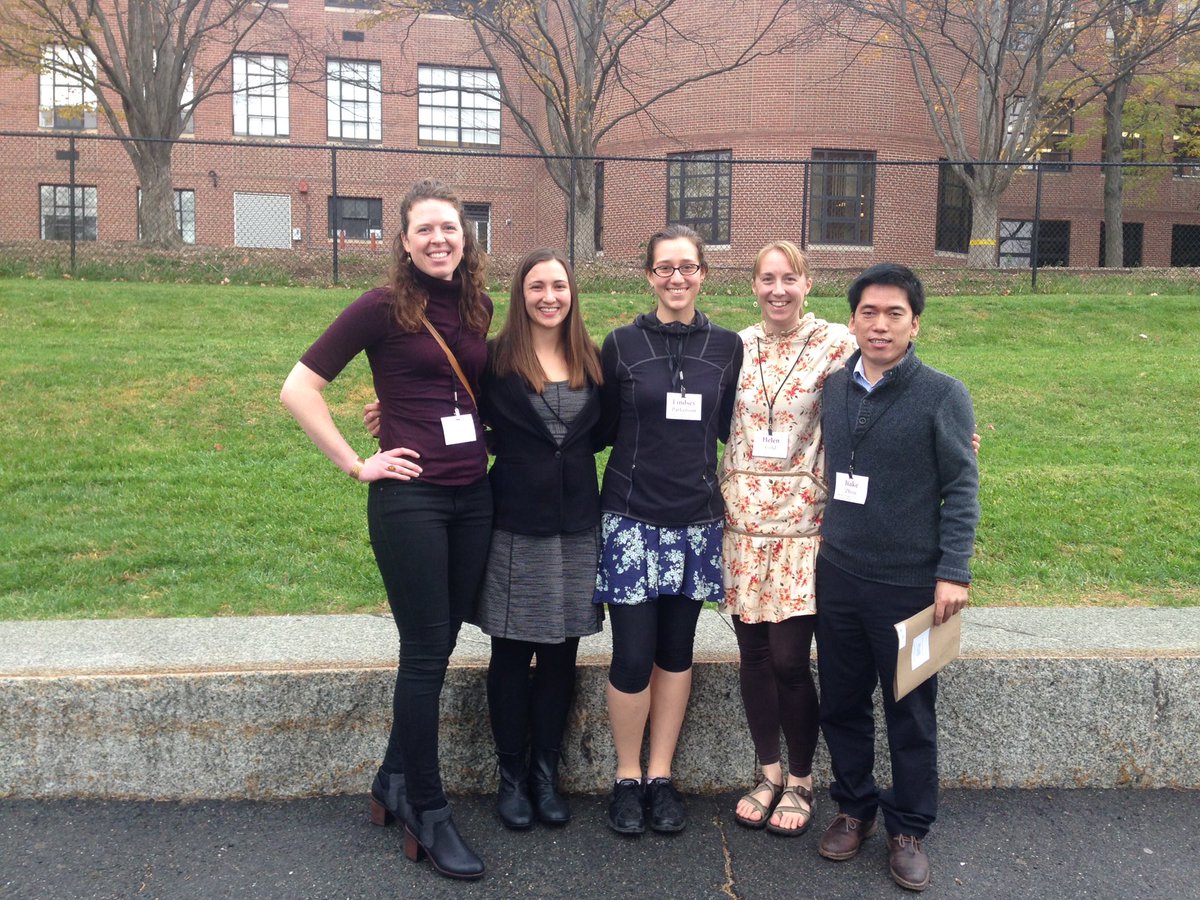
Cool…so why might this be? This is where things got exciting to me. My results were explainable! In the 1960s hunting restrictions were put in place for Pacific walruses. The population started to increase and it is thought that carrying capacity was reached at 1975 or shortly thereafter. As the population peaked, space and food became limited. Females were not able to get enough to eat and consequently could not afford to ovulate or bring a fetus to full term. Then in the 1980s, the hunting restrictions were lifted, the population was reduced and resources became more plentiful. Females had access to adequate food and started ovulating and calving more often and more successfully, hence the increase in size and number of corpora in the 90s. We don’t have much information for the 2008-10 time period but my results suggest that the population was reproducing at levels higher than in the 70s and slightly lower than in the 90s. This is great. Amazing! A grad students dream—having data that is statistically significant and trends that are explainable. “Go home and get to writing up your thesis,” I told myself feeling proud and accomplished. Me feeling proud and accomplished with the rest of the Alaska CSC group in Amherst, MA. A week after presenting this “amazing” stuff, I got to thinking and I awoke to a harsh reality. I was dreaming. I was sitting in the library in Juneau, at the same table I am actually typing this up now. I was staring at excel spread sheets and graphs of my data. I wanted to be sure that I was interpreting my results correctly, that in a few months from now when I presented this information at my thesis defense no one would point and laugh and say, “Hah, good one Jenell, but you really didn’t consider x, y and z here.” And I would be embarrassed and potentially fail. It was a good practice. I asked myself, “Is there anything else that could account for these differences in size, weight and number of corpora between samples?” The obvious thing I had been dealing with was the difference in preservatives used. Two of the three sets of ovaries were preserved in formalin whereas the smallest ovaries from 1975 were preserved in ethanol. I had already been working on a pilot study and the results from our pilot study said that there were no significant differences between treatment types. “Ok, what else? What else?” I racked my brains for a moment. Locations. That was different. The 1975 samples were from Little Diomede and the others were from St. Lawrence Island. But that shouldn’t matter. They are all samples from one population that migrates from St. Lawrence up to Little Diomede. Oh, my gosh. They migrate. They are harvested as they migrate. So they are killed as the ice breaks up first in the Bering and then up toward the Chukchi Sea. What do the harvest dates look like between locations??? 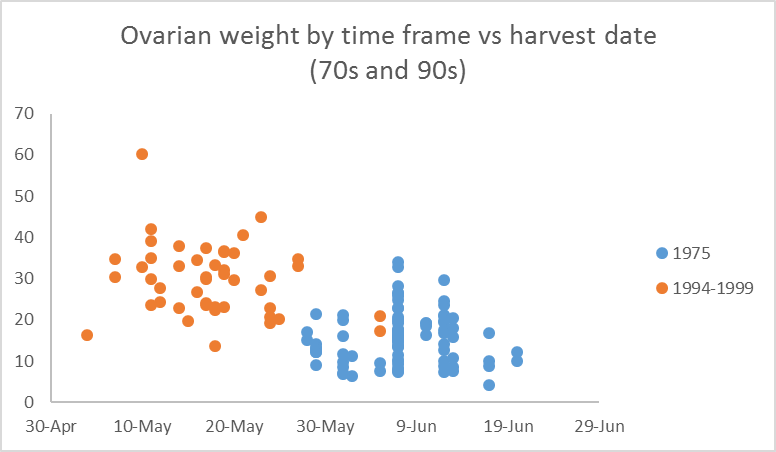 I am waiting to obtain harvest date info on the 2008-10 time frame but these 2 time periods have really distinct harvest windows. Volume showed the same trend as weight of ovaries. They look different. Really different. In fact, there is almost no overlap. I hadn’t accounted for this. I am no longer comparing apples to apples here. What am I going to do?
I would like to provide you with an overview of my project so you have some things to look forward to reading. My study has 2 parts, one part anatomy (looking at the shapes and sizes of organs with the naked eye) and one part physiology (using laboratory techniques to measure hormones in tissues of those organs). The organs of primary interest are ovaries. Ovaries are of course those egg-producing-machines mammals of all species possess! Let me show you a walrus ovary so you can have an idea of the image burned in my mind that I fall asleep picturing. 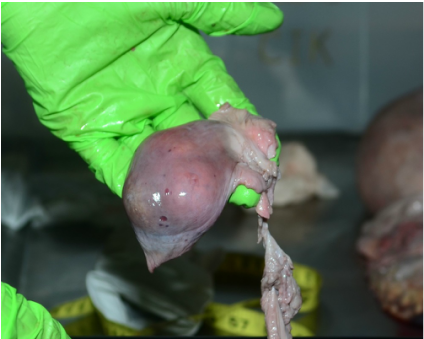 These 2 parts serve as 2 chapters of my thesis. I am currently focusing on the anatomy chapter. This chapter asks, "how has reproductive capacity of the female Pacific walrus changed over the past 40 years?" Yeah...it's a bit daunting. To answer this question will will be looking at ovaries from 3 time frames: 1975, 1994-99 and 2008-2010. And to make this question more manageable we will be measuring 3 things in our definition of "reproductive capacity": ovarian volumes, weights and the number of scars from ovulation. My chapter on physiology will be focused on building an understanding of the factors that influence reproduction on a fine scale. I will be looking specifically at progesterone and lipids. Progesterone is the hormone responsible for sustaining pregnancy and lipids are fats. Later this week I will post a blog about my findings from measuring ovarian weights and volumes, so stay tuned!
|
AuthorHi, I'm Jenell. Biologist, student, outdoors woman and author of Mother Walrus. Archives
March 2019
Categories |

 RSS Feed
